Relative crown projection systems for Douglas-fir

May 8, 2020

https://www.linkedin.com/posts/activity-6664514494074535937-mbDe

Back in the day when I was a scientist (1996), traditional individual-tree growth and relative basal area projection systems were compared to several relative crown size projection (RCP) systems for young Douglas-fir plantations. In addition to a relative crown size projection function, each RCP system also included prediction and projection functions for total height and dbh using the various expressions of crown size. Observed and predicted dbh distributions were compared by using two-sample Kolmogorov-Smirnov tests (see graph). Using the 95% confidence level, RCP systems methods provided better representation of observed dbh distributions in 15-40% of the stands than the traditional growth methods. Representation of diameter distributions obtained by using crown diameter alone (80.5% accepted) was improved in only 1.2% of the stands when using live crown profile and 2.4% of the stands when using live crown volume with slant height. When used to compute crown volume, live crown height was detrimental (4.5% fewer accepted) compared to using total height. RCP systems could be useful for forest planning and updating data obtained by either ground-based or remote-sensing forest inventory methods.

Evaluating precision and accuracy of forest inventory designs

January 6, 2020

https://www.linkedin.com/posts/activity-6619975361671286784-Nhku

PTAEDA 4.1 and the FMRC forest sampling simulator can be used to evaluate statistical precision, accuracy, and cost of alternative forest inventory designs. The examples show in silico estimates of sampling error (precision) on the y-axis and bias (accuracy) on the x-axis for trees/acre obtained from 30 sampling units of varying size and shape at ages 11 and 24 years. The number of measured trees/sampling unit is included as an index of cost. In the 11-year-old-stand, point samples with BAF 15 or larger exhibited high sampling error, high bias, or both. Also, large numbers of trees/sampling unit must be measured to obtain less than 10% sampling error and less than 10% bias. In the 24-year old stand, the number of measured trees/sampling unit is related to both precision and accuracy. Point samples with BAF 10 or less and several fixed-area plots resulted in less than 10% sampling error and less than 10% bias but with a smaller number of measured trees/sampling unit than in the younger stand.

Crown width-dbh projection system for green ash

May 21, 2020

https://www.linkedin.com/posts/activity-6669426243995230208-Dg4i

A crown width-diameter growth projection system for green ash was developed by using data from a crop tree enhancement study in a 16-year old bottomland site in Tennessee.  Treatments included release, release with fertilization, and control.  The crown width (CW) projection function uses initial CW and initial height, and includes response to release treatments with or without fertilization The dbh projection function uses initial dbh, periodic CW growth, and depth to mottling (depth to seasonal groundwater). The CW and dbh projection functions were fit as a system of seemingly unrelated regression (SUR) equations that accounted for 60.5% and 84.9% of the variation, respectively.

Maximum CW growth occurs when initial CW=6.6 ft in unreleased stands and when initial CW=12.0 ft in released stands.  The effects of CW growth on dbh growth vary with depth to mottling (DM), with maximum dbh growth when DM=15 in. The graphs show periodic annual dbh growth for initial dbh for control and release treatments at 3 initial crown widths and 3 depths to mottling.  These relationships suggest that CW growth is an indicator of interspecific competition, which is strongly influenced by seasonal groundwater that is greater than 22 in. deep and, to a lesser extent, less than 10 in. deep.

Crown width-dbh projection system for sweetgum

May 29, 2020

https://www.linkedin.com/posts/activity-6672104826991652865-Kbvq

Part 2 of 3 crop tree enhancement growth models is a crown width-diameter projection system for sweetgum.  Initial data were obtained from 14-year-old stand on an abandoned agricultural field that was remeasured 9 years later. Treatments included fertilization, release, release with fertilization, and control.  The crown width (CW) projection function uses initial CW, basal area of competing trees after treatment, and response to release only and release with fertilization. The dbh projection function uses initial dbh, periodic CW growth, and response to release with or without fertilization.  The CW and dbh projection functions were fit as a system of seemingly unrelated regression (SUR) equations.  Sweetgum exhibits a large growth response to release treatments, especially when fertilization is included.  The response to treatments is greatest for trees with small initial CW and low basal area of competitors.  Released trees have more resources available due to expansion into space previously occupied by competitors. A simple Shiny app was developed for this growth projection system.

Shiny app for sweetgum

GML output formats for Woodstock and Tigermoth

June 8, 2019

https://www.linkedin.com/posts/activity-6543201557175951360-IH3N

Comparison of GML output for Woodstock and Tigermoth

GML ver. 1.2.8 is capable of producing yield tables formatted for either Woodstock in txt files or Tigermoth in csv files.

A loblolly pine plantation with 2 thinnings would have 3 tables in Woodstock: unthinned yields with first thinning removals; post-first thin yields with second thinning removals; and post-second thin yields. Each table includes a row with stand name, species, thinning regime information, and other themes plus a row of column headers. Tigermoth tables do not have breaks between stands and thinning regimes and have just one column header. Data for a loblolly pine plantation with 2 thinnings are ordered by species with unthinned yields, first thinning removals, post-first thin yields, second thinning removals, and finally post-second thin yields.

FMRC sampling simulator

August 26, 2018

https://www.linkedin.com/posts/activity-6447662069964693504-V_pk

Simulator interface and sampled stand maps

Here is a preview of forest sampling simulation software that was developed in collaboration with Forest Modeling Research Cooperative staff and graduate students at Virginia Tech. The software will be presented as a poster and demonstrated at the #SOMENS conference in Blacksburg, VA, on October 28-30. Oral presentations by graduate students Corey Green and Sheng-I Yang will summarize results for different stand conditions and sampling configurations.

The software uses tree size and quality attributes and coordinates generated by PTAEDA 4.1. Random samples, with or without replacement, or systematic samples can be simulated using fixed-area circular, square, or rectangular plots (0.01- to 1.0-acre) or point samples (BAF 5 to 100). Samples can be repeated up to 100 times to generate sampling distributions. Sample-based estimates can be compared to known population values based on all trees.

The example shows the sample configuration interface and randomly-selected circular, square, and point sampling units in a loblolly pine plantation with 10×10 ft spacing. Green circles represent live trees, yellow “+”s represent the center of each sampling unit, and red circles represent trees included on each sampling unit.

https://lnkd.in/eERe_QD

GENS (GML Extension for Natural Stands)

September 9, 2018

https://www.linkedin.com/posts/activity-6444741014832902144-0-9L

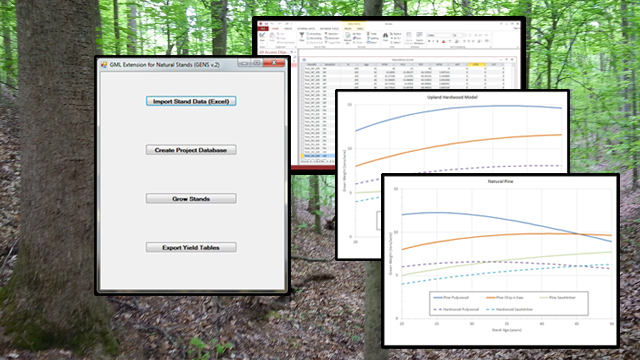
GENS interface, output, and growth trends

GML Extension for Natural Stands (GENS) was developed to supplement the growth of pine plantations provided by GML. GENS consists of volume growth functions for natural stands of pine, pine-hardwoods, upland hardwoods, and bottomland hardwoods with cypress. This Windows program is being migrated to ASP.NET and subscription services along with the main GML software.

Initial age, base age 50 site index, initial volume by product and species group, maximum age, and forest type are supplied to GENS by importing an Excel workbook. Volume growth is obtained by applying a compounded growth rate calculated from initial volume and volume for the grown age for a given site index. Results are stored in an Access database, and yield tables can be generated for use in optimization software.

Examples of growth for upland hardwoods and natural pine stands are shown for site index 75 in the graphs. As expected, the green weight of pine and hardwood pulpwood tends to decrease with increasing age, while pine chip-n-saw and both pine and hardwood sawtimber tends to increase.

Dbh distributions for genetically improved planations in GML

July 16, 2018

https://www.linkedin.com/posts/activity-6424736645244809216-kFit

Predicted dbh distributions by PRS score

Here is a sneak peek of a new growth and yield feature for genetically improved families in GML 1.3, which will be released in the near future. Diameter distributions and product yields can be predicted by using genetics performance rating systems, which typically consist of productivity, rust resistance, and straightness.

The example shows dbh distributions for unthinned loblolly pine (age 25, site index 75, 8×10 ft spacing) with several productivity ratings. Using a set of preliminary functions, maximum dominant height and basal area response increase with increasing site index and productivity rating, and the maximum response occurs at age 30. As the productivity rating increases, dbh distributions shift to larger diameters and chip-n-saw and sawtimber yield increases by about 10%, or 35 tons/acre. Depending on the rust and straightness ratings, a portion of the potential solid wood products can be reallocated to pulpwood or non-merchantable volume.

Product distribution by PRS score

Local volume equations for Tennessee forests

July 30, 2018

Web-based application interface

Obtaining the height of trees is time-consuming and difficult, especially for species with a decurrent crown architecture. Measuring height to a fixed top diameter is one approach to avoid this problem, but that can be as subjective as total height. Another approach is to use local volume equations, which do not require height measurements. 

Local equations were developed by using Forest Inventory and Analysis (FIA) data in Tennessee.  Within a given FIA region, tree content can be estimated to any top diameter in terms of cubic ft volume, green weight, and board ft volume (Doyle and International log rules). In the example, yellow-poplar in the East Tennessee region with dbh=16 in. and top diameter=11 in. contains 129.8 bd ft (Doyle log rule), 197.7 bd ft (International log rule tables), 29.1 cubic ft, and 1923.6 lbs.

http://steveknowe.com/TennVol/LocalVolume.htm (case sensitive)

Yield simulator for loblolly and slash pine plantations

August 28, 2018

https://www.linkedin.com/posts/activity-6439985520859758592-VTQ8

Web-based user interface and output

This ASP.NET application generates diameter distributions and yield for loblolly and slash pine plantations. The example shows the diameter distribution, yield by dbh and product, and summary statistics for a 25-year-old slash pine plantation with site index=65 and initial (age 10) trees/acre=350. Results can be exported into an Excel worksheet.

ASP.NET and SQL Server are being used to develop a web-based, subscription version of GML, with batch processing, genetics and silvicultural response functions, and thinning and mid-rotation fertilization at multiple ages.